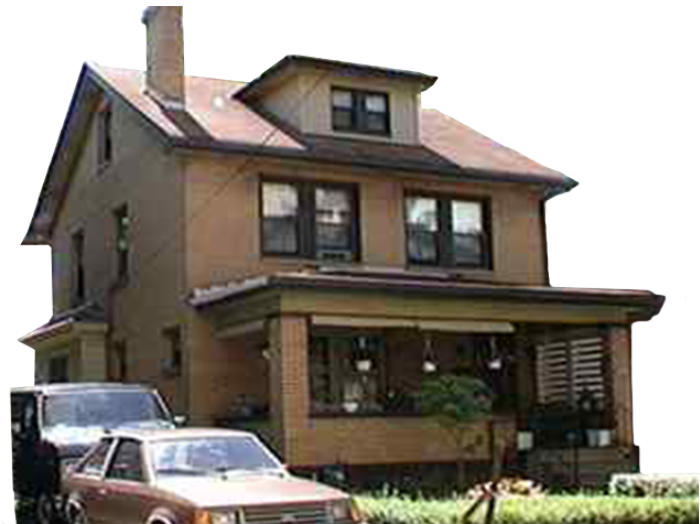
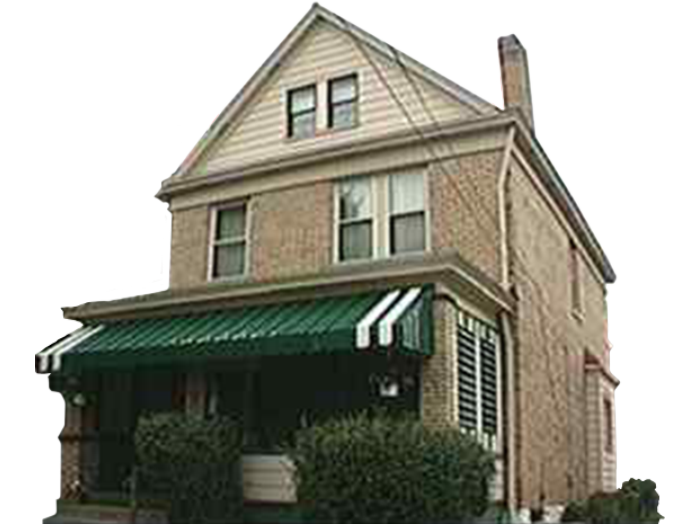
The majority of U.S. municipalities chronically overtax non-white homeowners and low-value homes. We analyzed Allegheny County assessment and real estate data from 2012-2020 to reveal that during these years, the county assessed Pittsburgh’s lowest value homes at twice their same-year market value, while the highest value homes were assessed at just over half their market value. We also found that Pittsburgh’s black homes were assessed at 7.5% more, on average, than comparable white homes.
Governments calculate the property tax for a given home by estimating its market value, and taking a certain percentage of that value (determined by the millage rate) for each tax-collecting body in the area.
All millage rates for a tax-collection body are uniform, so variation in tax rates is purely related to assessment values. As a result, inequity arises when assessments are inconsistently measured.
A home’s assessment ratio captures the relationship between the value on which it is taxed and the value for which it would sell.
Most counties perform assessments regularly to keep assessment values up to date, and ensure taxes are distributed proportionally. In Pennsylvania, however, regular reassessment is not required by law. Allegheny County’s most recent reassessment took place in 2012, and assessment values have been held constant since then despite local market fluctuations.
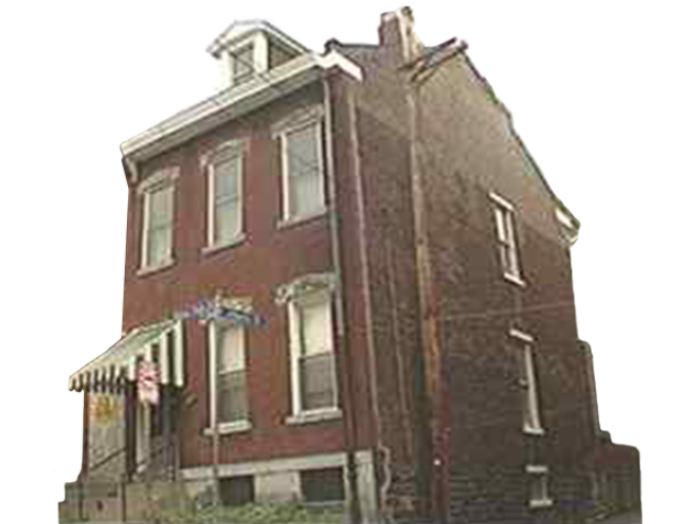
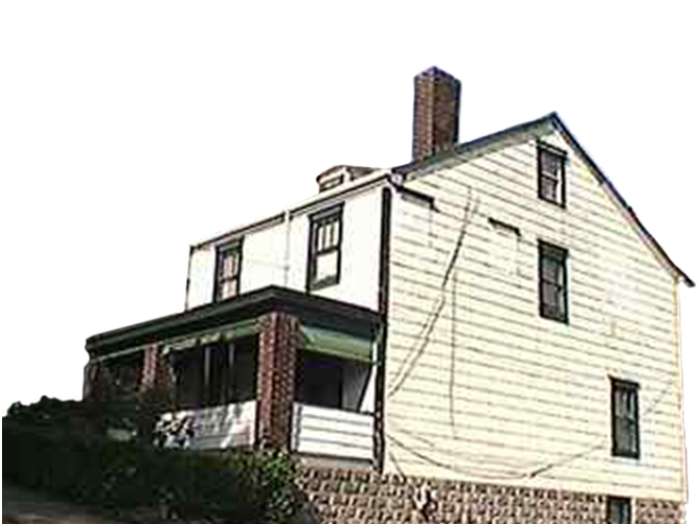
Using property level data about assessment value, sale price, and demographic information for representative properties in the city of Pittsburgh, we are able to examine racial disparity in property tax assessment at a granular level.
Overall, our study indicates that properties in Pittsburgh are taxed at an average of 72.5% of their fair market values.
However, this rate is not consistent across income, race, or property value. In fact, it is sharply regressive on all of these dimensions.
A similar trend is evident in the relationship of income to assessment ratio, where the lowest-earning homeowners are taxed at an average rate 1.28x higher than the highest-earning homeowners.
This property value and income data is tied to racial bias. Black homeowners represent a disproportionate number of the lowest-valued properties and the lowest-earning households. The heavy clustering of low-value property in Black neighborhoods combined with the over-assessment of that property results in racially biased tax regressivity.
These distributions show that property values, and to a lesser extent assessment ratios, coincide with racial boundaries. Because Black Homeowners tend to have properties of lower value, and lower-value properties tend to be over-assessed, Black Homeowners are more likely to be over-taxed.
Controlling for census tract eliminates this statistically significant racial gap, indicating that racial bias in property assessment operates through location. In other words, while Black homes are not individually over-assessed, Black neighborhoods are.
Regressive property taxation is one element of a long history of redlining and discriminatory urban policy that has created dense clusters of low-value housing. This financial structure contributes to the consolidation of low-income homeowners in specific areas, and works to prevent them from dispersing outside of those areas.
Our results show that accounting for local differences could almost entirely eliminate the racial and class-based disparities in Pittsburgh’s property tax. We strongly encourage the County Assessor’s office to recalibrate the assessment process in response to this conclusion.
We invite you to explore the map below, and discover the trends of property taxation in your neighborhood.
For more information about this project and property taxation in Pittsburgh, have a look at our About Page. You can download a pdf of the full City of Pittsburgh Property Tax Regressivity and Racial Inequality: 2012-2020 report here.